Le Quiou
Commune in Brittany, France
Le Quiou Ar C'haeoù | ||
|---|---|---|
Commune | ||
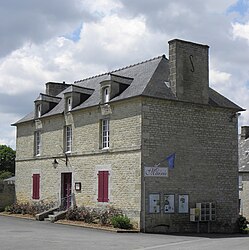 The town hall of Le Quiou | ||
Location of Le Quiou  | ||
(2020–2026) Arnaud Carré[1] | | |
| Area 1 | 5.06 km2 (1.95 sq mi) | |
| Population (2021)[2] | 351 | |
| • Density | 69/km2 (180/sq mi) | |
| Time zone | UTC+01:00 (CET) | |
| • Summer (DST) | UTC+02:00 (CEST) | |
| INSEE/Postal code | 22263 /22630 | |
| Elevation | 13–77 m (43–253 ft) | |
| 1 French Land Register data, which excludes lakes, ponds, glaciers > 1 km2 (0.386 sq mi or 247 acres) and river estuaries. | ||
Le Quiou (French pronunciation: [lə kju]; Breton: Ar C'haeoù) is a commune in the Côtes-d'Armor department of Brittany in northwestern France.
Geography
Climate
Le Quiou has a oceanic climate (Köppen climate classification Cfb). The average annual temperature in Le Quiou is 11.8 °C (53.2 °F). The average annual rainfall is 714.9 mm (28.15 in) with November as the wettest month. The temperatures are highest on average in July, at around 18.4 °C (65.1 °F), and lowest in January, at around 5.8 °C (42.4 °F). The highest temperature ever recorded in Le Quiou was 40.4 °C (104.7 °F) on 5 August 2003; the coldest temperature ever recorded was −14.5 °C (5.9 °F) on 25 February 1986.
| Climate data for Le Quiou (1981–2010 averages, extremes 1985−2020) | |||||||||||||
|---|---|---|---|---|---|---|---|---|---|---|---|---|---|
| Month | Jan | Feb | Mar | Apr | May | Jun | Jul | Aug | Sep | Oct | Nov | Dec | Year |
| Record high °C (°F) | 17.0 (62.6) | 22.1 (71.8) | 24.3 (75.7) | 28.8 (83.8) | 32.0 (89.6) | 37.0 (98.6) | 39.7 (103.5) | 40.4 (104.7) | 34.1 (93.4) | 30.8 (87.4) | 21.6 (70.9) | 17.0 (62.6) | 40.4 (104.7) |
| Mean daily maximum °C (°F) | 8.9 (48.0) | 9.8 (49.6) | 12.8 (55.0) | 15.1 (59.2) | 19.0 (66.2) | 22.0 (71.6) | 24.2 (75.6) | 24.1 (75.4) | 21.5 (70.7) | 17.2 (63.0) | 12.3 (54.1) | 9.3 (48.7) | 16.4 (61.5) |
| Daily mean °C (°F) | 5.8 (42.4) | 6.1 (43.0) | 8.4 (47.1) | 10.1 (50.2) | 13.6 (56.5) | 16.4 (61.5) | 18.4 (65.1) | 18.4 (65.1) | 15.9 (60.6) | 12.8 (55.0) | 8.7 (47.7) | 6.2 (43.2) | 11.8 (53.2) |
| Mean daily minimum °C (°F) | 2.7 (36.9) | 2.5 (36.5) | 4.0 (39.2) | 5.0 (41.0) | 8.3 (46.9) | 10.7 (51.3) | 12.6 (54.7) | 12.6 (54.7) | 10.2 (50.4) | 8.5 (47.3) | 5.1 (41.2) | 3.0 (37.4) | 7.1 (44.8) |
| Record low °C (°F) | −12.0 (10.4) | −14.5 (5.9) | −7.2 (19.0) | −4.8 (23.4) | −1.6 (29.1) | 2.6 (36.7) | 4.5 (40.1) | 3.5 (38.3) | 0.7 (33.3) | −5.5 (22.1) | −6.6 (20.1) | −8.5 (16.7) | −14.5 (5.9) |
| Average precipitation mm (inches) | 70.4 (2.77) | 55.0 (2.17) | 50.2 (1.98) | 54.6 (2.15) | 63.7 (2.51) | 48.7 (1.92) | 49.3 (1.94) | 46.0 (1.81) | 57.4 (2.26) | 70.3 (2.77) | 77.7 (3.06) | 71.6 (2.82) | 714.9 (28.15) |
| Average precipitation days (≥ 1.0 mm) | 12.3 | 10.9 | 10.2 | 10.9 | 9.5 | 7.4 | 7.6 | 7.9 | 8.4 | 11.8 | 13.3 | 13.0 | 123.1 |
| Source: Meteociel[3] | |||||||||||||
Population
| Year | Pop. | ±% |
|---|---|---|
| 1962 | 326 | — |
| 1968 | 331 | +1.5% |
| 1975 | 319 | −3.6% |
| 1982 | 313 | −1.9% |
| 1990 | 286 | −8.6% |
| 1999 | 305 | +6.6% |
| 2008 | 327 | +7.2% |
The inhabitants of Le Quiou are known in French as quiousiens.
See also
References
- ^ "Répertoire national des élus: les maires". data.gouv.fr, Plateforme ouverte des données publiques françaises (in French). 2 December 2020.
- ^ "Populations légales 2021" (in French). The National Institute of Statistics and Economic Studies. 28 December 2023.
- ^ "Normales et records pour Le Quiou (22)". Meteociel. Retrieved 20 June 2022.
External links
Wikimedia Commons has media related to Le Quiou.
- Base Mérimée: Search for heritage in the commune, Ministère français de la Culture. (in French)
- v
- t
- e

- Allineuc
- Andel
- Aucaleuc
- Beaussais-sur-Mer
- Bégard
- Belle-Isle-en-Terre
- Berhet
- Binic-Étables-sur-Mer
- Bobital
- Le Bodéo
- Bon Repos sur Blavet
- Boqueho
- La Bouillie
- Bourbriac
- Bourseul
- Bréhand
- Brélidy
- Bringolo
- Broons
- Brusvily
- Bulat-Pestivien
- Calanhel
- Callac
- Calorguen
- Le Cambout
- Camlez
- Canihuel
- Caouënnec-Lanvézéac
- Carnoët
- Caulnes
- Caurel
- Cavan
- Les Champs-Géraux
- La Chapelle-Blanche
- La Chapelle-Neuve
- Châtelaudren-Plouagat
- La Chèze
- Coadout
- Coatascorn
- Coatréven
- Coëtlogon
- Coëtmieux
- Cohiniac
- Corlay
- Corseul
- Créhen
- Dinansubpr
- Duault
- Éréac
- Erquy
- Évran
- Le Faouët
- Le Fœil
- Fréhel
- Gausson
- Glomel
- Gomené
- Gommenec'h
- Gouarec
- Goudelin
- Grâces
- Grâce-Uzel
- Guenroc
- Guerlédan
- Guingampsubpr
- Guitté
- Gurunhuel
- La Harmoye
- Le Haut-Corlay
- Hémonstoir
- Hénanbihen
- Hénansal
- Hénon
- Hillion
- Le Hinglé
- Île-de-Bréhat
- Illifaut
- Jugon-les-Lacs
- Kerbors
- Kerfot
- Kergrist-Moëlou
- Kerien
- Kermaria-Sulard
- Kermoroc'h
- Kerpert
- Lamballe-Armor
- Lancieux
- Landebaëron
- Landébia
- La Landec
- Landéhen
- Lanfains
- Langoat
- Langrolay-sur-Rance
- Languédias
- Languenan
- Langueux
- Lanleff
- Lanloup
- Lanmérin
- Lanmodez
- Lannebert
- Lannionsubpr
- Lanrelas
- Lanrivain
- Lanrodec
- Lantic
- Lanvallay
- Lanvellec
- Lanvollon
- Laurenan
- Lescouët-Gouarec
- Le Leslay
- Lézardrieux
- Locarn
- Loc-Envel
- Loguivy-Plougras
- Lohuec
- Loscouët-sur-Meu
- Louannec
- Louargat
- Loudéac
- Maël-Carhaix
- Maël-Pestivien
- Magoar
- La Malhoure
- Mantallot
- Matignon
- La Méaugon
- Mégrit
- Mellionnec
- Le Mené
- Merdrignac
- Mérillac
- Merléac
- Le Merzer
- Minihy-Tréguier
- Moncontour
- La Motte
- Moustéru
- Le Moustoir
- Noyal
- Pabu
- Paimpol
- Paule
- Pédernec
- Penguily
- Penvénan
- Perros-Guirec
- Peumerit-Quintin
- Plaine-Haute
- Plaintel
- Plancoët
- Pléboulle
- Plédéliac
- Plédran
- Pléguien
- Pléhédel
- Plélan-le-Petit
- Plélauff
- Plélo
- Plémet
- Plémy
- Plénée-Jugon
- Pléneuf-Val-André
- Plérin
- Plerneuf
- Plésidy
- Pleslin-Trigavou
- Plestan
- Plestin-les-Grèves
- Pleubian
- Pleudaniel
- Pleudihen-sur-Rance
- Pleumeur-Bodou
- Pleumeur-Gautier
- Pléven
- Plévenon
- Plévin
- Plœuc-l'Hermitage
- Ploëzal
- Plorec-sur-Arguenon
- Plouaret
- Plouasne
- Ploubazlanec
- Ploubezre
- Plouëc-du-Trieux
- Plouër-sur-Rance
- Plouézec
- Ploufragan
- Plougonver
- Plougras
- Plougrescant
- Plouguenast-Langast
- Plouguernével
- Plouguiel
- Plouha
- Plouisy
- Ploulec'h
- Ploumagoar
- Ploumilliau
- Plounérin
- Plounévez-Moëdec
- Plounévez-Quintin
- Plourac'h
- Plourhan
- Plourivo
- Plouvara
- Plouzélambre
- Pludual
- Pluduno
- Plufur
- Plumaudan
- Plumaugat
- Plumieux
- Plurien
- Plusquellec
- Plussulien
- Pluzunet
- Pommeret
- Pommerit-le-Vicomte
- Pont-Melvez
- Pontrieux
- Pordic
- Prat
- La Prénessaye
- Quemper-Guézennec
- Quemperven
- Quessoy
- Quévert
- Le Quillio
- Quintenic
- Quintin
- Le Quiou
- La Roche-Jaudy
- Rospez
- Rostrenen
- Rouillac
- Ruca
- Runan
- Saint-Adrien
- Saint-Agathon
- Saint-Alban
- Saint-André-des-Eaux
- Saint-Barnabé
- Saint-Bihy
- Saint-Brandan
- Saint-Brieucpref
- Saint-Caradec
- Saint-Carné
- Saint-Carreuc
- Saint-Cast-le-Guildo
- Saint-Clet
- Saint-Connan
- Saint-Connec
- Saint-Denoual
- Saint-Donan
- Saint-Étienne-du-Gué-de-l'Isle
- Sainte-Tréphine
- Saint-Fiacre
- Saint-Gildas
- Saint-Gilles-les-Bois
- Saint-Gilles-Pligeaux
- Saint-Gilles-Vieux-Marché
- Saint-Glen
- Saint-Hélen
- Saint-Hervé
- Saint-Igeaux
- Saint-Jacut-de-la-Mer
- Saint-Jean-Kerdaniel
- Saint-Jouan-de-l'Isle
- Saint-Judoce
- Saint-Julien
- Saint-Juvat
- Saint-Launeuc
- Saint-Laurent
- Saint-Lormel
- Saint-Maden
- Saint-Martin-des-Prés
- Saint-Maudan
- Saint-Maudez
- Saint-Mayeux
- Saint-Méloir-des-Bois
- Saint-Michel-de-Plélan
- Saint-Michel-en-Grève
- Saint-Nicodème
- Saint-Nicolas-du-Pélem
- Saint-Péver
- Saint-Pôtan
- Saint-Quay-Perros
- Saint-Quay-Portrieux
- Saint-Rieul
- Saint-Samson-sur-Rance
- Saint-Servais
- Saint-Thélo
- Saint-Trimoël
- Saint-Vran
- Senven-Léhart
- Sévignac
- Squiffiec
- Taden
- Tonquédec
- Tramain
- Trébédan
- Trébeurden
- Trébrivan
- Trébry
- Trédaniel
- Trédarzec
- Trédias
- Trédrez-Locquémeau
- Tréduder
- Treffrin
- Tréfumel
- Trégastel
- Tréglamus
- Trégomeur
- Trégonneau
- Trégrom
- Trégueux
- Tréguidel
- Tréguier
- Trélévern
- Trélivan
- Trémargat
- Trémel
- Tréméreuc
- Trémeur
- Tréméven
- Trémorel
- Trémuson
- Tréogan
- Tressignaux
- Trévé
- Tréveneuc
- Trévérec
- Trévou-Tréguignec
- Trévron
- Trézény
- Troguéry
- Uzel
- La Vicomté-sur-Rance
- Le Vieux-Bourg
- Le Vieux-Marché
- Vildé-Guingalan
- Yffiniac
- Yvias
- Yvignac-la-Tour
- pref: prefecture
- subpr: subprefecture
Authority control databases | |
|---|---|
| International |
|
| National |
|
 | This Côtes-d'Armor geographical article is a stub. You can help Wikipedia by expanding it. |
- v
- t
- e


